

More Than a Platform. It's a Movement.
XRS Manager is the first gamified, scoring and tournament platform from STEAM Your Dreams (SYD). It brings together teams, competitions and data to help scholars learn, compete and grow, and turns participation into real educational impact.
Real Learning.
Real Impact.
Our Mission
Inspire, engage and empower scholars through STEAM, gaming, sports and immersive experiences.
Our Vision
A world where every child has access to modern, relevant, innovative learning in everyday life through technology.
We make learning fun through play. Activities reinforce classroom concepts and build useful life skills, from financial, health and food literacy to brain games, playground challenges and educational esports.
Product Ecosystem
Each product plays a specific role. Together they power the movement.
CAMS: The Three Pillars
CAMS is the foundational performance framework for the whole platform. It is not just a points system. It connects brain development, physical activity and esports performance into one measurable ecosystem.

Brain Games
Cognitive development and STEAM learningSTEAM projects, science experiments, technology activities, engineering challenges, math and logic puzzles. We track project completion, assessment scores, correct answers, attempts, time spent and learning milestones.
Playground Games
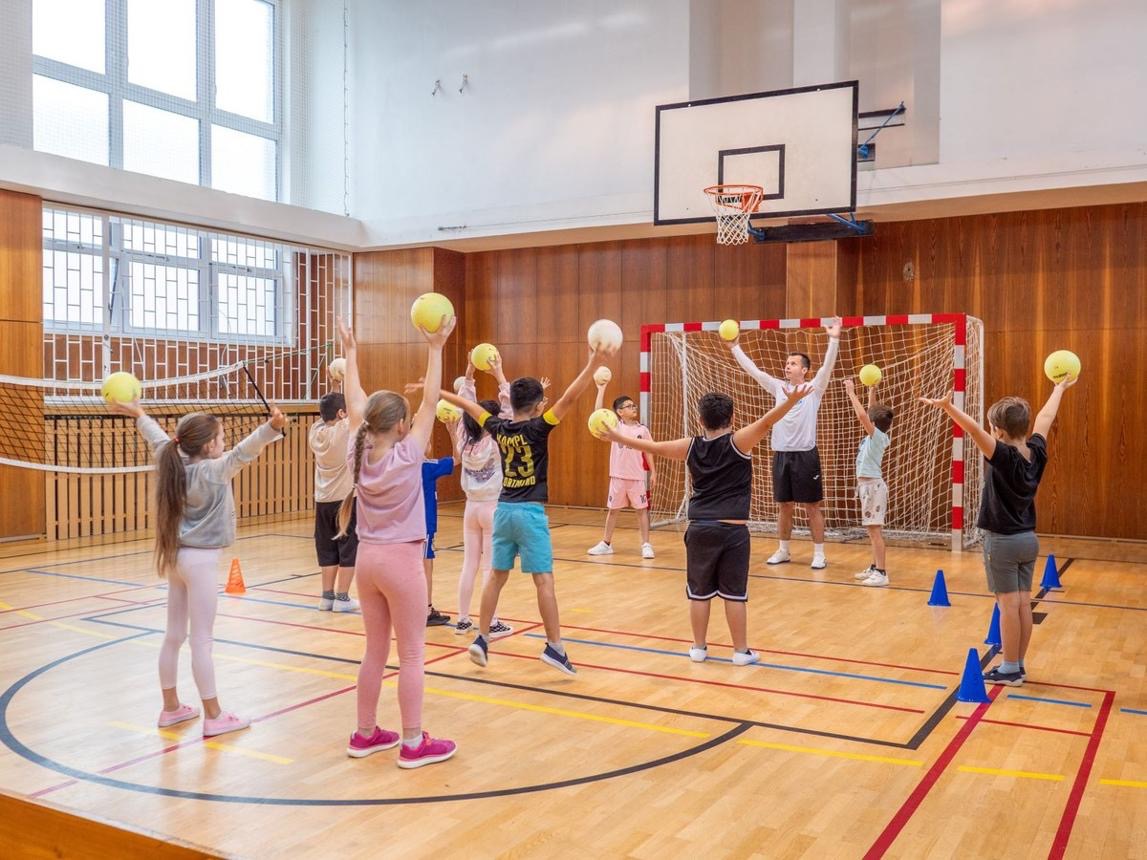
Physical activity, movement and team engagementExercise games, throwing challenges, jumping jacks, basketball dunks and team activities that reward scholars with extra balls, attempts or other gameplay advantages. We track repetitions, completion, participation, bonus balls earned and teamwork.
E Gaming and E Sports
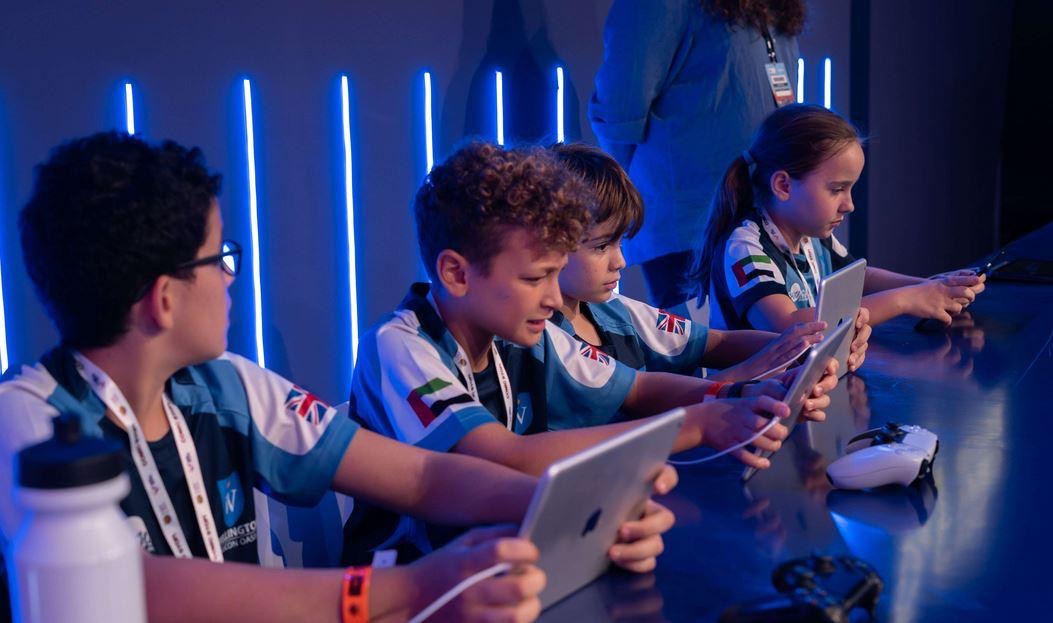
Digital competition and applied learningXR Sports titles, quiz integrated games, individual and team competitions, tournaments and brackets. We track wins and losses, scores, accuracy, completion times, tournament progression, boosters and sportsmanship.
From Play to Progress
A simple process. Real results.
1
Complete a CAMS mission: a brain game, STEM project or playground challenge.
2
Record performance telemetry: completion, accuracy, time, effort and answers.
3
Award points and gameplay benefits: XP, bonus balls, boosters, badges and team power ups.
4
Compete in E Gaming and E Sports: results, rankings and tournament progression.
5
Measure growth over time: scholar, team, site and program analytics.
The Gamification Center
Five connected management areas turn performance into recognition, competition and insight.
Badges and Awards
Recognition for mission completion, mastery, consistency, effort, teamwork, leadership, sportsmanship and tournament achievements.
Mission Challenges
Missions with configurable rules, deadlines, point values and rewards for individuals, teams and groups.
Analytics and Reports
Compare performance by activity, pillar, scholar, team, coach, site and program over days, weeks and seasons.
Leaderboards and Tournaments
Individual and team standings, results, brackets and championships, kept separate from bonus rewards.
Telemetry and Performance Intelligence
A unified record of activities, answers, attempts, scores, rewards and outcomes.
XRS Manager LITE Gamification Center
The LITE Gamification Center is built around a Stats Dashboard, an Infographic Board, a Gamification Info Board and Event Stats. The dashboard shows the results, the infographic board visualizes the results, the gamification info board gives the detailed records, and event stats follow attendance and progress for each player.
Stats Dashboard
What is happening?The quick overview: total scholars participating, activities completed, points earned, Brain Games, Playground Games and E Gaming counts, active teams, completed tournaments, and recent achievements and top performers. Filter by date, camp, site, team and activity.
Infographic Board
What does the performance look like?Raw statistics turned into simple charts: CAMS pillar participation, points by activity type, team and player comparisons, wins, losses and tournament progress, mission completion rates, weekly and monthly trends, and most played games. Printable and shareable summaries.
Gamification Info Board
What happened, who did it, and what data supports the result?The detailed performance record. Each submenu gives a deeper view of what happened, who participated and how results were generated.
| Gamification Info Board | Event Stats | |
|---|---|---|
| Player Stats | Activities played, points, accuracy, completion, achievements, personal bests | |
| Team Stats | Team points, participation, wins, losses, assists, teamwork rewards | |
| Camp and Site Stats | Active scholars, sessions, participation, activity totals, site comparisons | |
| Brain Games Stats | STEM projects completed, incomplete projects, quiz accuracy, attempts, mission points | |
| Playground Games Stats | Physical challenges completed, repetitions, bonus balls, boosters earned | |
| E Gaming and E Sports Stats | Matches, wins, losses, scores, questions answered, tournament rankings | |
| Mission and Activity Stats | Starts, completions, completion rate, time spent, rewards issued | |
| Tournament Stats | Brackets, match results, advancement, standings, champions | |
| Rewards and Power Ups | Points awarded, badges earned, boosters issued, redemptions or usage | |
| Activity History | Date, activity, participant, result, points awarded, event details | |
XRS Manager LITE and STEAM IQ
Both use the same CAMS framework and serve different purposes. LITE is complete and useful on its own.
XRS Manager provides free access to play, participate and track basic performance. STEAM IQ provides the deeper program management, analytics and accountability tools needed for measured enrichment programming. The free version must remain valuable on its own, not feel like a limited trial of a paid product.
XRS Manager LITE100% free
Play, participation and basic engagement for schools, parks and recreation and youth organizations.
- Three CAMS pillars
- Points, badges and simple leaderboards
- Game scores, wins, losses and tournaments
- Basic mission and participation history
STEAM IQAdvanced
Learning outcomes, KPIs and program accountability for structured enrichment programming.
- Advanced telemetry and longitudinal analytics
- Configurable district and recreation center KPIs
- Reading, math, science and attendance reporting
- Impact reports for administrators and funders
What stays free and what belongs in STEAM IQ
| Capability | XRS Manager LITE | STEAM IQ |
|---|---|---|
| Three CAMS pillars | Included | Included |
| Basic points and badges | Included | Included |
| Game scores and tournament standings | Included | Included |
| Basic mission tracking | Included | Included |
| Participation history | Included | Included |
| Advanced telemetry and trend analysis | Basic summaries | Full analytics |
| Custom partner KPIs | Basic activity goals | Configurable KPI framework |
| Academic outcome comparisons | Basic activity results | Detailed outcome reporting |
| Advanced LMS and assessment analytics | Basic completion visibility | Detailed learning analytics |
| Program impact reports | Basic summaries | Comprehensive reporting |
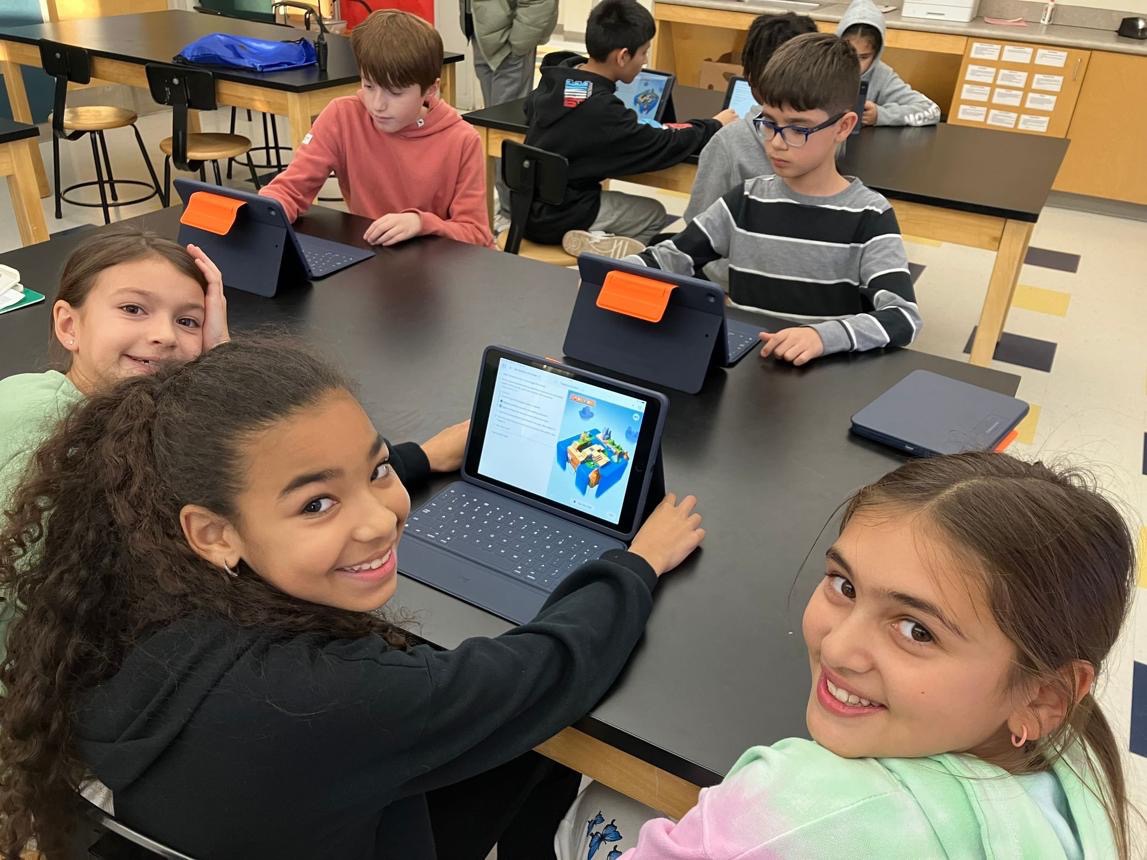
Supplemental Programming
XRS Manager LITEThe goal is to make learning fun through play. Activities reinforce classroom concepts and introduce useful life skills without requiring a formal academic intervention or district level KPI framework.
Examples include financial literacy, health literacy, food literacy, brain games, playground challenges and educational esports.
Measure: participation, activity completion, points, game performance, engagement and basic learning interactions.

Enrichment Programming
STEAM IQThe goal is to deliver structured programming against outcomes established with a school district, recreation center or other partner.
Examples include improving reading proficiency, math competency, science understanding, attendance, STEM performance and completion of designated learning modules.
Measure: baseline performance, target KPIs, assessment results, progress over time, participation and demonstrated outcomes.
Recorded for every event
| Capability | Recorded for every event | |
|---|---|---|
| Identity | Scholar, team, coach, site and program | |
| Activity | CAMS pillar, mission, game, project or LMS module | |
| Performance | Start time, completion time, attempts, score, accuracy and status | |
| Learning | Questions presented, answers, correctness, assessment results and module completion | |
| Rewards | Points earned, bonus points, badges, balls, boosters and power ups | |
| Competition | Match ID, opponent, result, win or loss, bracket position and tournament | |
| Progress | Previous results, personal bests, skill growth and activity history | |
What leadership can see
The reporting layer answers meaningful questions:
- Are scholars participating more frequently over time?
- Which brain games or STEM projects produce the strongest learning results?
- Are scholars improving their accuracy and problem solving?
- Which playground activities generate the most participation and bonus rewards?
- Do earned power ups influence esports outcomes?
- Which teams demonstrate the strongest sportsmanship and collaboration?
- How do results differ across schools, recreation centers, camps and youth programs?
- How many scholars start and complete LMS modules?
- What is changing from one week, program cycle or season to the next?
These reports support program improvement, coach evaluations, school reporting, grant reporting and evidence of impact. The system measures relationships between learning activities, rewards and competitive outcomes without assuming that a correlation proves one caused the other.
Real Data. Real Results.
Our platform connects play to progress. Every activity is recorded, so programs can see participation, learning and growth in real numbers.
Gamify Everything!
Play. Learn. Compete. Grow.
For schools, parks and recreation and youth organizations.
Get Started - It's Free